


About half of Americans are planning to watch the 2024 Super Bowl between the San Francisco 49ers and the Kansas City Chiefs — and some of that interest may be driven by a certain pop star who's neither playing nor (scheduled to be) performing.
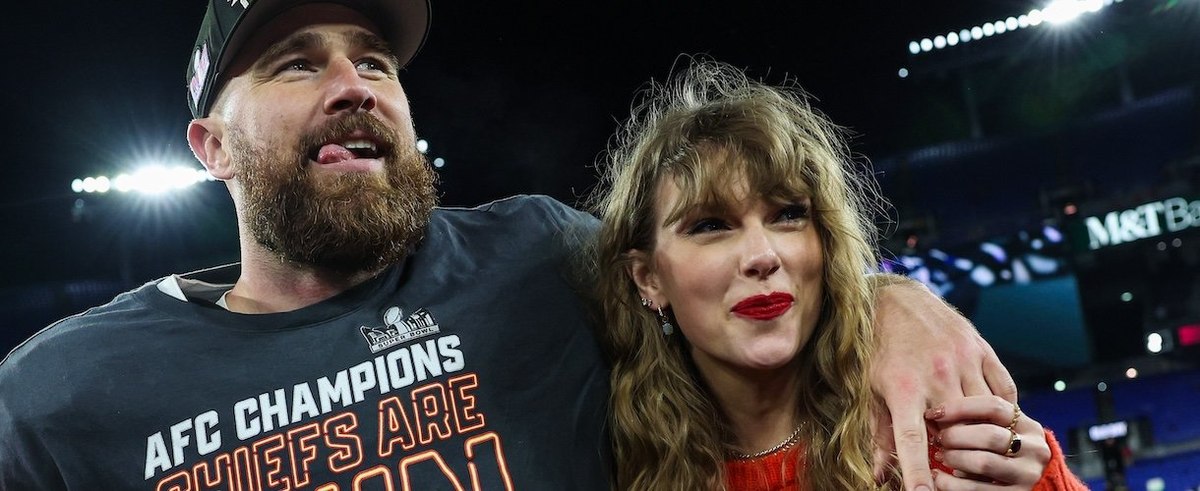
More than two-thirds (68%) of American adults who say they have a "very favorable" opinion about Taylor Swift — whose relationship with Chiefs tight end Travis Kelce is a leading Super Bowl storyline — say they'll definitely or probably watch the Super Bowl. 51% of Americans overall plan to watch.
Below, other findings from recent YouGov surveys about Super Bowl LVIII, which kicks off Sunday at 6:30 p.m. Eastern Time, including:
- Most Americans who do plan to watch the Super Bowl say they'll watch at home
- Americans are divided in their rooting interests between the Chiefs and 49ers
- People are generally happy with the choice of Usher as the halftime performer
- 22% of Americans plan to make a bet about the Super Bowl
Who's going to watch the big game?
The Super Bowl telecast is broadly popular, with around half of Americans planning to watch across a range of demographics. 54% of adults under 30 plan to watch, as do 47% of those 65 years old or older. 56% of men and 46% of women say they'll watch, as do 47% without college degrees and 58% with degrees.
Views about Swift, however, are strongly associated with Super Bowl-watching plans. Among the 24% of Americans with very favorable views of Swift, 68% plan to watch the game. The less favorable Americans are about Swift, the less likely they are to plan to watch Super Bowl LVIII, with just 33% of those with a very unfavorable view planning to tune in.
Of those who do plan to watch the game, most say they'll do it at home. 52% plan to watch at home by themselves or with other members of their household, and another 13% plan to host friends or family. 18% plan to watch at someone else's house, and 9% plan to watch the game in some public place such as a bar or Allegiant Stadium itself.
Most Super Bowl viewers say their favorite part of the broadcast is the football game itself (59%), while 18% prefer the halftime show and 20% are watching for the ads.
Men, Americans 65 years old or older, and college graduates are most likely to say their favorite part is the game. Women, younger Americans, and non-college graduates are comparatively more likely to prefer the halftime show or commercials, but even within each of these groups the actual game is the most popular part of the broadcasts.
Who Americans want to win and think will win
Americans are conflicted about which team they’d like to see win: 27% prefer the 49ers while 26% want a Chiefs win and 47% don't care. Midwesterners are more likely to favor the Chiefs while more Westerners want a San Francisco win, though even in each of those regions more than 40% don't care who wins. Among Swifties — people with very favorable opinions of Swift — 41% want the Chiefs to win while 31% want a 49ers win.
As for who Americans expect to win, 35% say the Chiefs while just 25% name the 49ers. 47% of Swifties expect a Kansas City win compared to just 30% who pick the Niners.
In recent years, the Economist/YouGov Poll has a mixed record of picking the Super Bowl winner. The team that more Americans expected to win did in fact win in 2019 and 2022, while it lost in 2021. Last year equal shares of Americans picked the Chiefs — who won — and the Eagles.
A separate YouGov poll of U.S. adults finds a similar edge for the Chiefs in Americans' forecast of the Super Bowl winner. This poll has asked Americans for their Super Bowl picks each week since just before the start of the postseason. Both teams playing Sunday were favored by less than 10% of Americans before the start of the playoffs, then picked up believers as other teams were eliminated.
Swift and Kelce are both popular
Americans tend to like the big names associated with Super Bowl LVIII. Swift; halftime performer Usher; stars Travis Kelce, Patrick Mahomes, and Brock Purdy; and coaches Andy Reid and Kyle Shanahan all are more liked than disliked. Some of these figures aren't well-known, however: majorities of Americans don't know enough about Reid, Purdy, or Shanahan to have an opinion of them.
Most Americans — 59% — have a very or somewhat favorable view of Taylor Swift. Opinions of her vary with political identification: 73% of Democrats and Independents who lean Democratic have a very or somewhat favorable view of her while only 19% are unfavorable; among Republicans and Independents who lean Republican, 49% are favorable and 43% unfavorable.
As for Kelce, the star Kansas City tight end who is dating Swift, he is viewed favorably by 46% of Americans and unfavorably by 17%. Swifties love Kelce: 72% are favorable about him and only 5% are unfavorable.
Other findings from YouGov surveys related to the upcoming Super Bowl:
- By 38% to 13%, Americans are satisfied rather than dissatisfied with Usher being chosen as this year's Super Bowl halftime performer. 42% say they don't care.
- When asked which recent halftime performer they've enjoyed most, the largest share (14%) of Americans say the 2020 show with Eminem, Dr. Dre, Snoop Dogg, Kendrick Lamar, and Mary J. Blige, followed by Rihanna's 2023 performance (10%) and the 2020 performance by Jennifer Lopez, Shakira, Bad Bunny, J Balvin, and Emme Muniz (9%). The smallest share — 2% — say Justin Timberlake and the Tennessee Kids in 2018.
- One in five Americans — 22% — plan to make a bet related to this year's Super Bowl, including 19% who will bet online and 13% who will make a bet in person.
- Americans are split (36% to 36%) on whether they approve or disapprove of presidential candidates running campaign ads during the Super Bowl.
See the toplines and crosstabs from the Economist/YouGov poll conducted on February 4 - 6, 2024 among 1,591 U.S. adult citizens.
Methodology:
The weekly surveys about who Americans think will win the Super Bowl were conducted on January 10 - 11, 2024 (of 6,080 U.S. adults), January 17, 2024 (of 5,109 U.S. adults), January 25, 2024 (of 4,730 U.S. adults), February 1, 2024 (of 9,719 U.S. adults), and February 8, 2024 (of 10,201 U.S. adults). The samples were weighted according to gender, age, race, education, U.S. census region, and political party.
Other survey data comes from The Economist/YouGov poll. Respondents were selected from YouGov’s opt-in panel using sample matching. A random sample (stratified by gender, age, race, education, geographic region, and voter registration) was selected from the 2019 American Community Survey. The sample was weighted according to gender, age, race, education, 2020 election turnout and presidential vote, baseline party identification, and current voter registration status. Demographic weighting targets come from the 2019 American Community Survey. Baseline party identification is the respondent’s most recent answer given prior to November 1, 2022, and is weighted to the estimated distribution at that time (33% Democratic, 31% Republican). The margin of error for the overall sample is approximately 3%.
Image: Getty (Patrick Smith)